Digital Analytics
UX Research
Time:
4 Weeks
My Role:
Data Analyst
UX Researcher
Methods:
Data Collection
Dashboard Creation
SEO Analysis
Social Media Analytics
How can Creative Capital improve their digital reach to potential donors in the Arts?
Creative Capital is a nonprofit, grant making organization with the mission to fund artists in the creation of groundbreaking new work, to amplify the impact of their work, and to foster sustainable artistic careers. In 1999, Creative Capital was established as a nonprofit public charity after the National Endowment for the Arts (NEA) ended the majority of its grants for individual artists. Each year, Creative Capital receives approximately 4,000 artist project applications. To date, Creative Capital has awarded millions in grants and services to 901 artists to create 730 innovative new projects. I worked with them during my Digital Analytics course to analyze and identify meaningful ways for the organization to improve their digital content reach to those who can support the incredible cause.
My Team
Tereza Chanaki
Priyanka Jain
Chelsea Yip
Zixuan Zhao
Website Traffic
Gather data from Social and website
What client questions can we try answer using Digital Analytics?
How are visitors to the site engaging with Donor Pages?
Content Strategy
What social media content best engages Creative Capital’s audience?
Create visualizations to identify analytics insights
Social Growth
Present our findings and create a report for Creative Capital
How much social growth is happening for Creative Capital?
Content Traffic
Is the digital content bringing people to the site?
01
What areas do Creative Capitals need insights on?
Our process and research goals
Our process
Meeting with Digital Director Aliza Sena from Creative Capital
Identifying the project’s research objectives
02
Utilizing Digital Analytics tools to visualize the data
Super Metrics
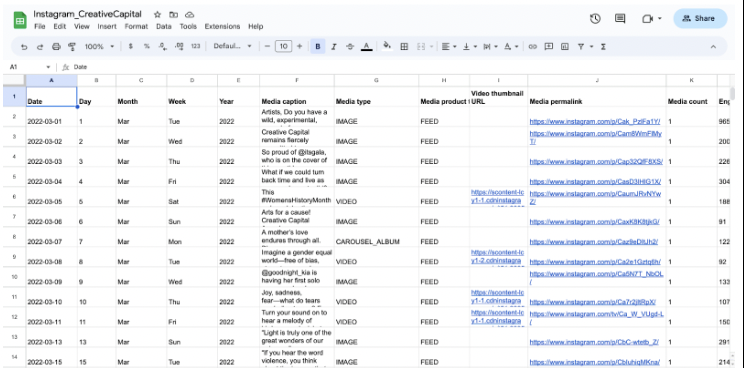
In order to gather data on Creative Capital's Instagram account, we used Supermetrics, a social media analytics tool that integrates with various platforms including Instagram. We focused on three key areas of analysis: engagement, overall account details, and Instagram posts related to donations.
Google Analytics
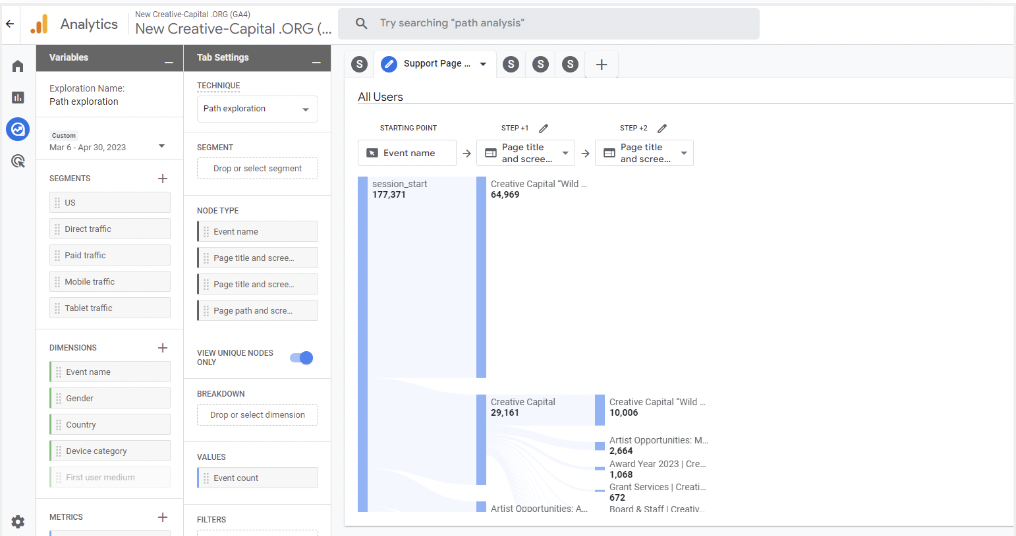
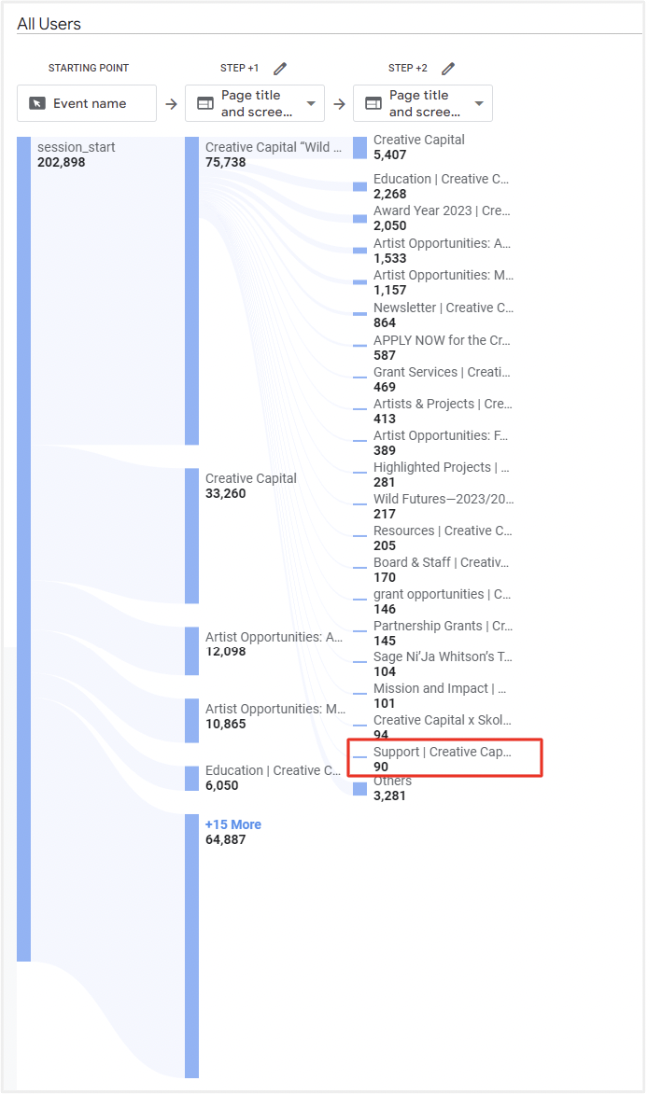
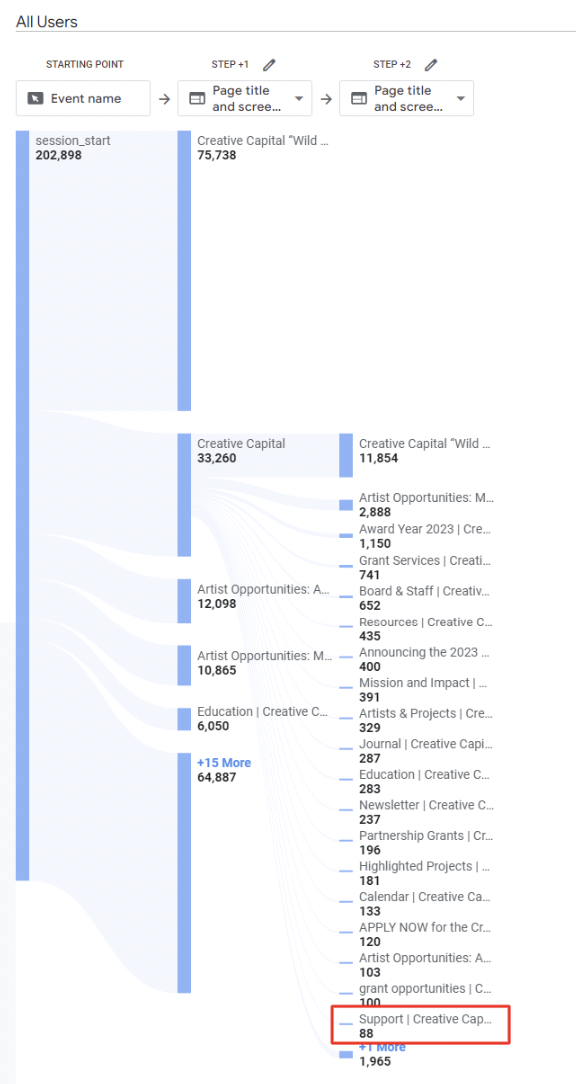
We created journey maps that follow user traffic throughout Creative Capital’s website to reach the Support Page. To do this, we used the Path Exploration tool within GA4 to visualize the user journey from session start to reaching the Support page.
Looker Studio
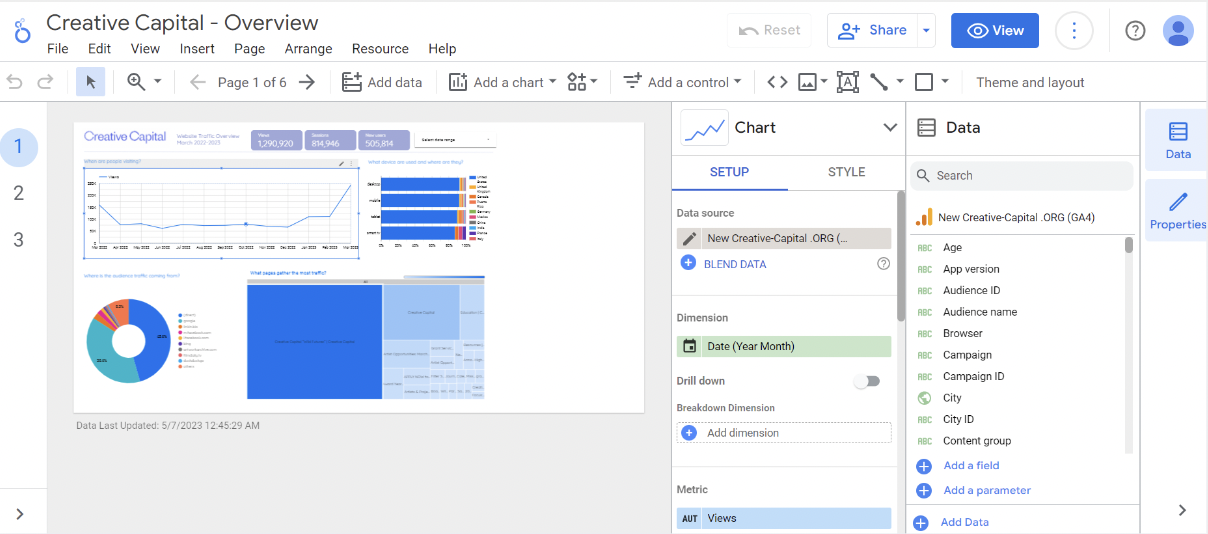
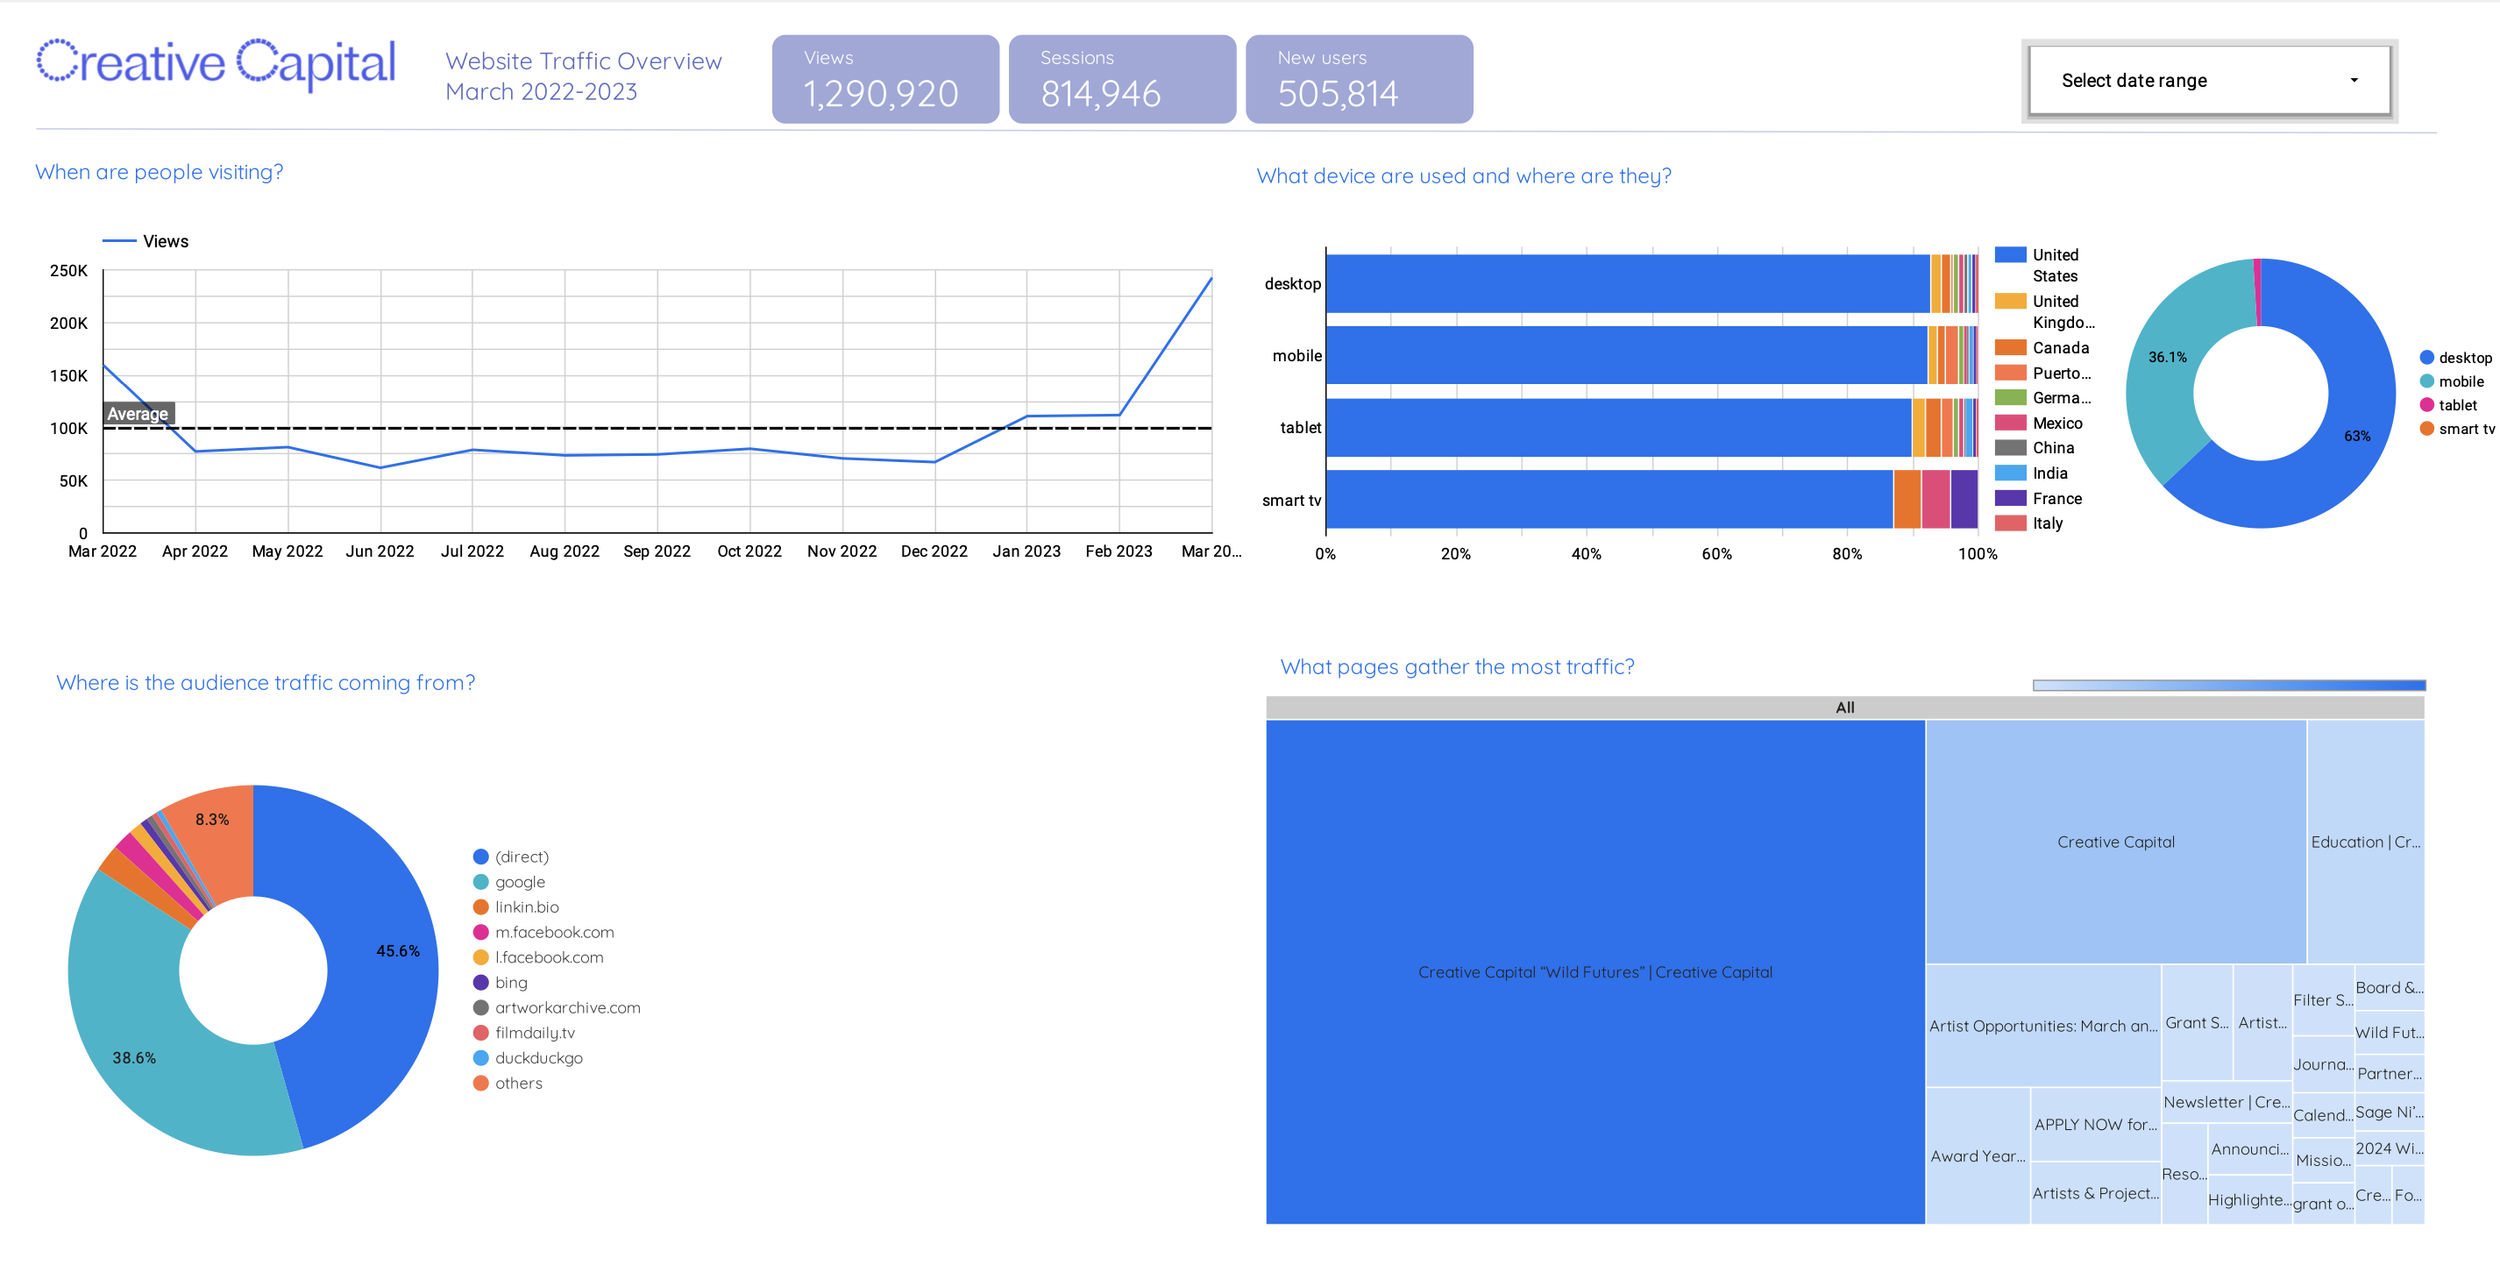
For our Looker Studio Dashboard, we decided to offer a general overview of the website traffic, as well as a breakdown of their behavior in relation to Creative Capital’s Support and Membership pages. Looker Studio’s visualization options made the data more accessible! After our conversations with Creative Capital, we asked the following questions:
When are people visiting?
What devices are used and where are they located?
Where does audience traffic come from?
Which pages receive the most traffic?
1. Path Exploration reveals low traffic to Support page
2. Findability of Support page is hidden by support posts for social causes
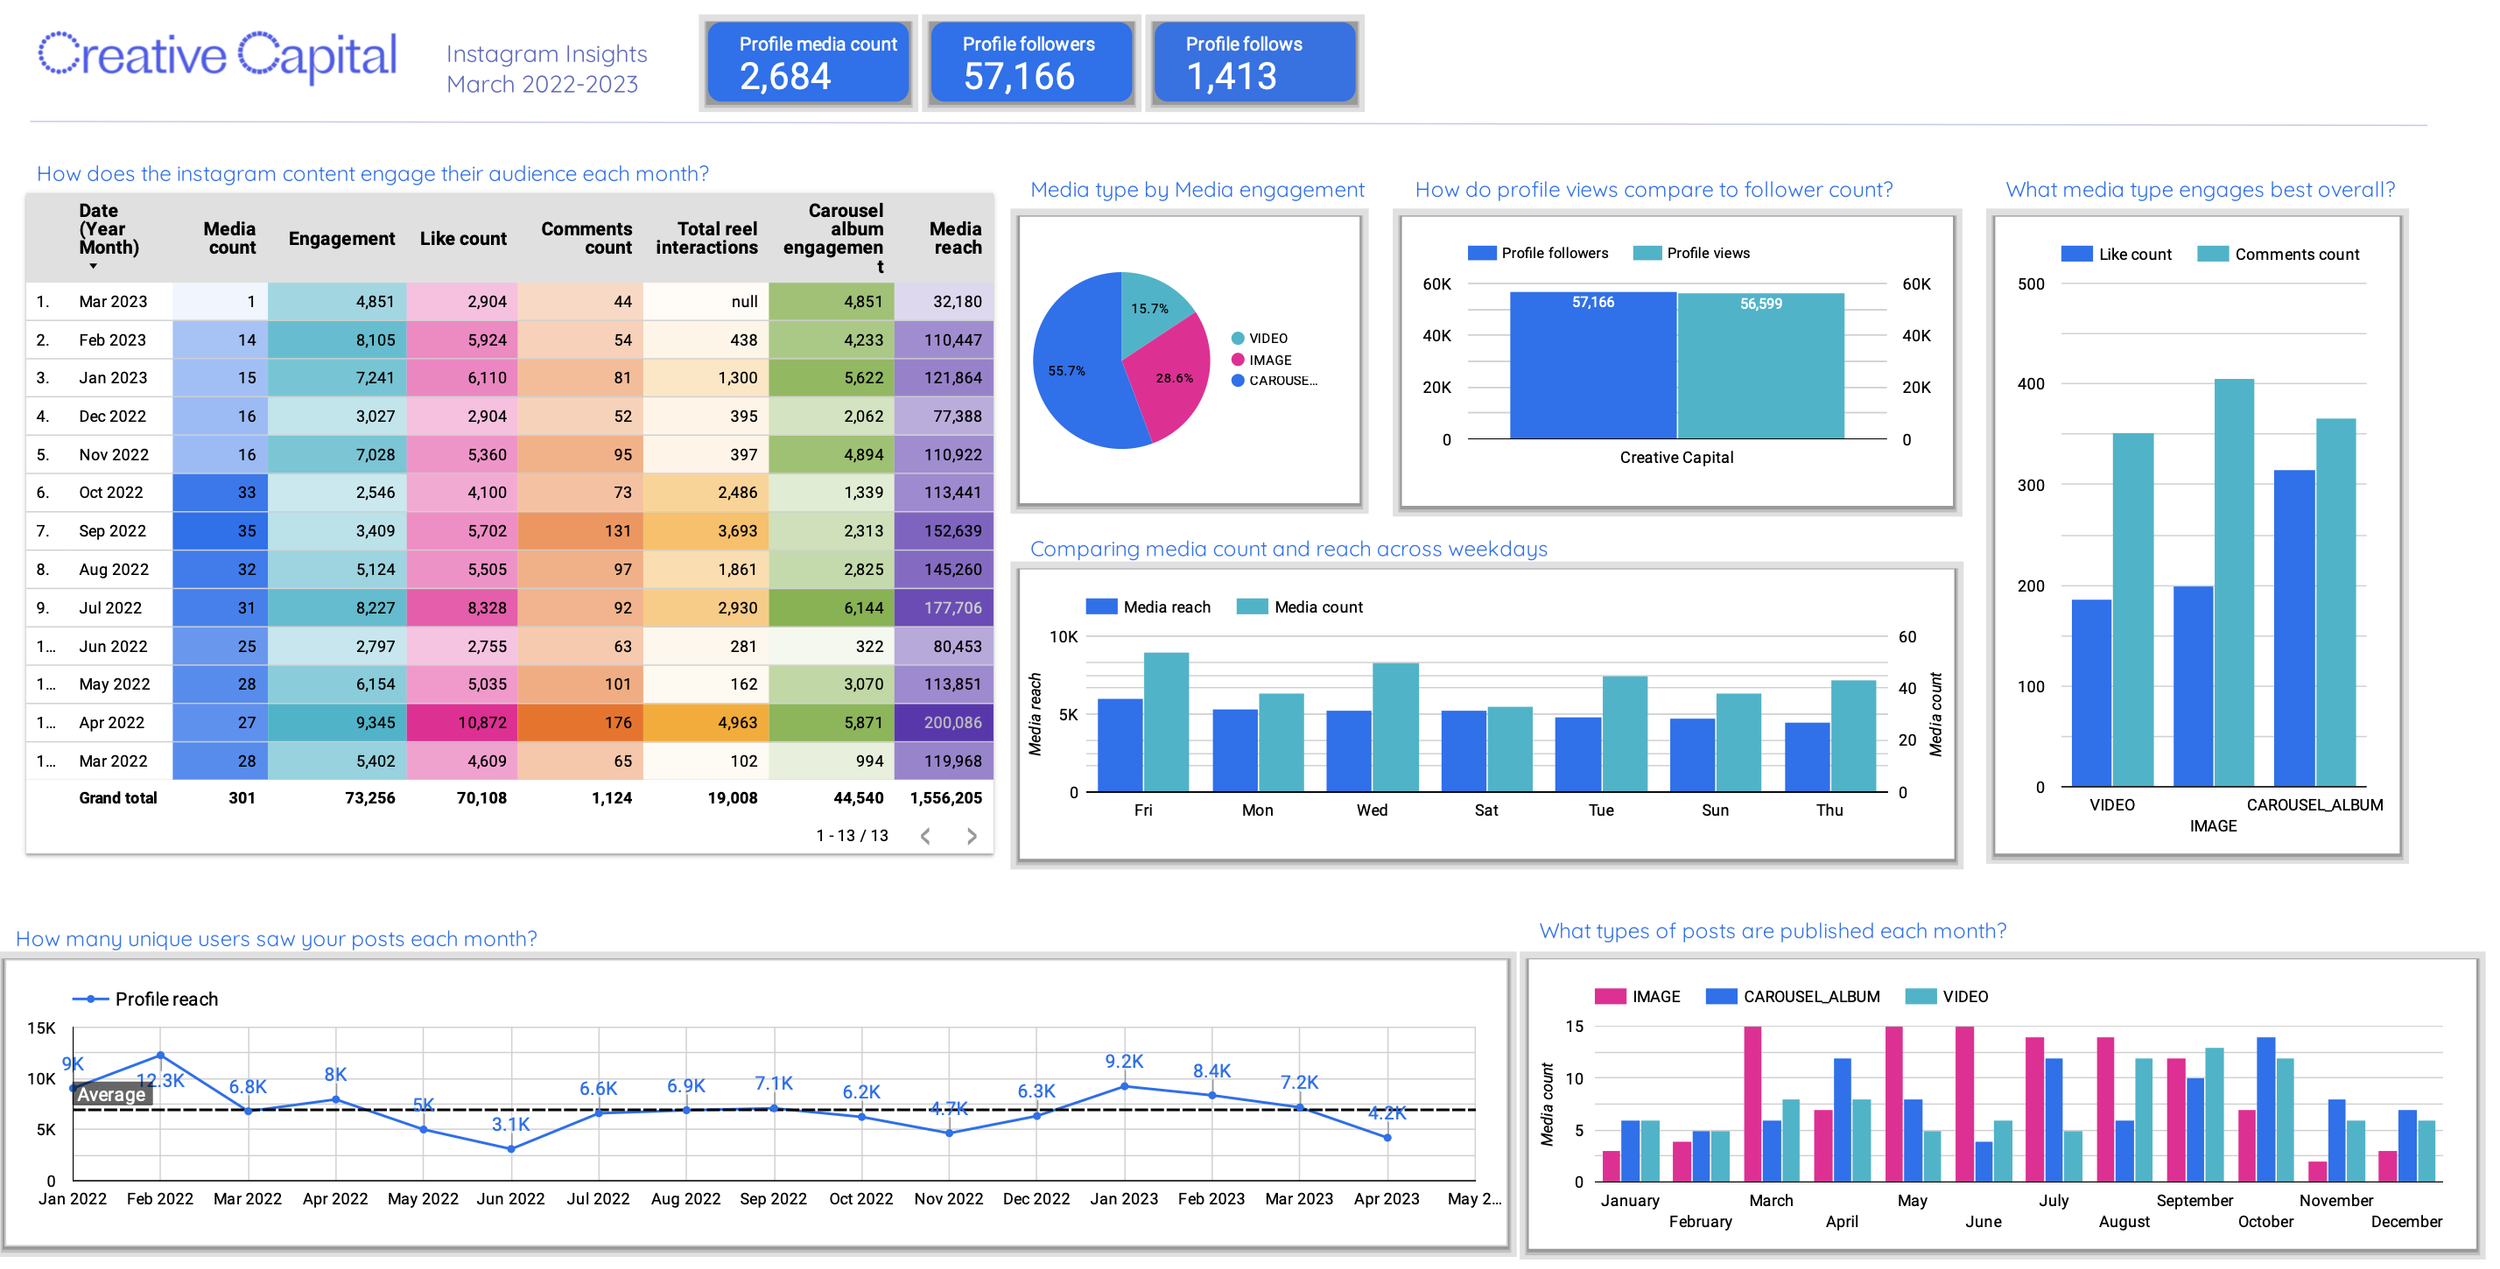
Our Looker Studio dashboards included an overview of the sites traffic, audience, reach and traffic by device breakdown. We also included a social media overview page for the Digital team to see how different content types are performing along with profile reach.
63% of traffic to desktop
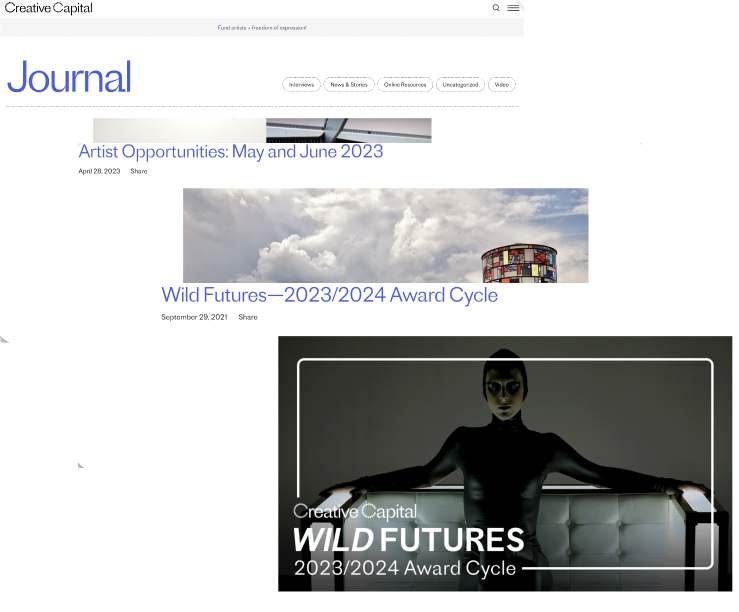
Journal Pages examples
Our big findings
3. Donate page is lacking engagement in terms of specific impact metrics content
Social Media Dashboard
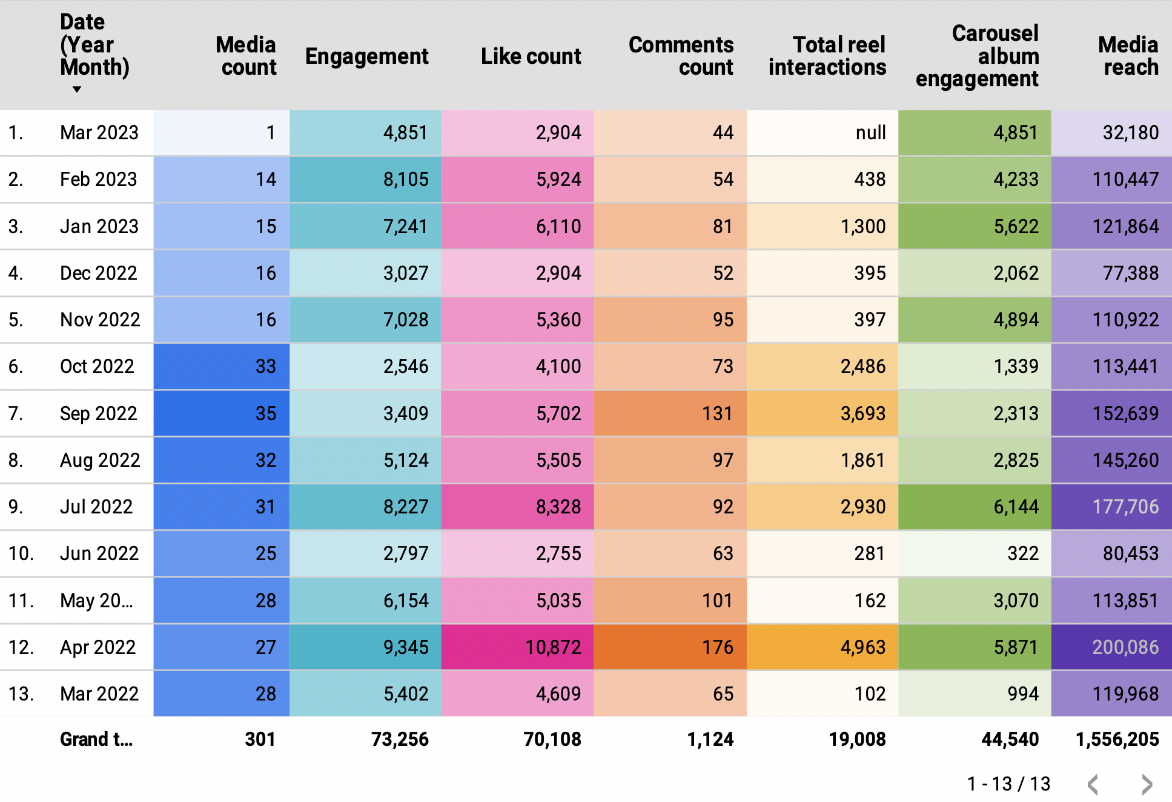
4. Surge in Instagram Engagement in April 2022 due to the use of videos, carousels, and themed posts
Designing Dashboards to visualize Creative Capital’s digital performance
Overview Page
03
What did we find out?
General Insights and Findings
~100K Monthly Visitors
39% of traffic stems from Google
7K Visitors from Instagram
What is working well for Creative Capital?
Our analysis revealed Creative Capital’s journal to be its greatest asset, as journal posts regularly receive high traffic. The monthly Artist Opportunities journal posts are both popular landing pages for inbound website traffic as well as jumping points to other website pages, and Wild Futures related journal posts similarly receive high engagement. We recommend maintaining the current cadence and content of journal posts.
Findings and Recommendation 1
Finding 01: Path explorations reveal low traffic to support pages
Where did we see this?
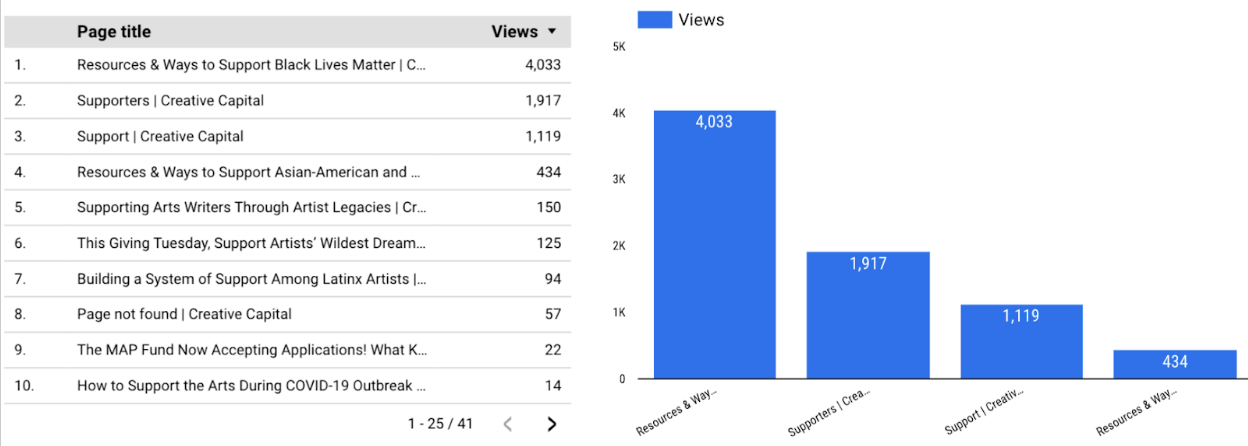
Support page receives <.1% of website traffic which we noted through the Universal Analytics (Google Analytics 3) website data. We noticed this from March 2022 to March 2023, only 1,119 users viewed it out of the total 1,290,920 website viewers, which translates to only 0.09% of total website visitors accessing the Support page.
How could this be improved?
Use “donate” to refer to financially supporting Creative Capital & place donate button in footer
User visits to the Support Pages are limited as noted through Google Analytics Path Explorations
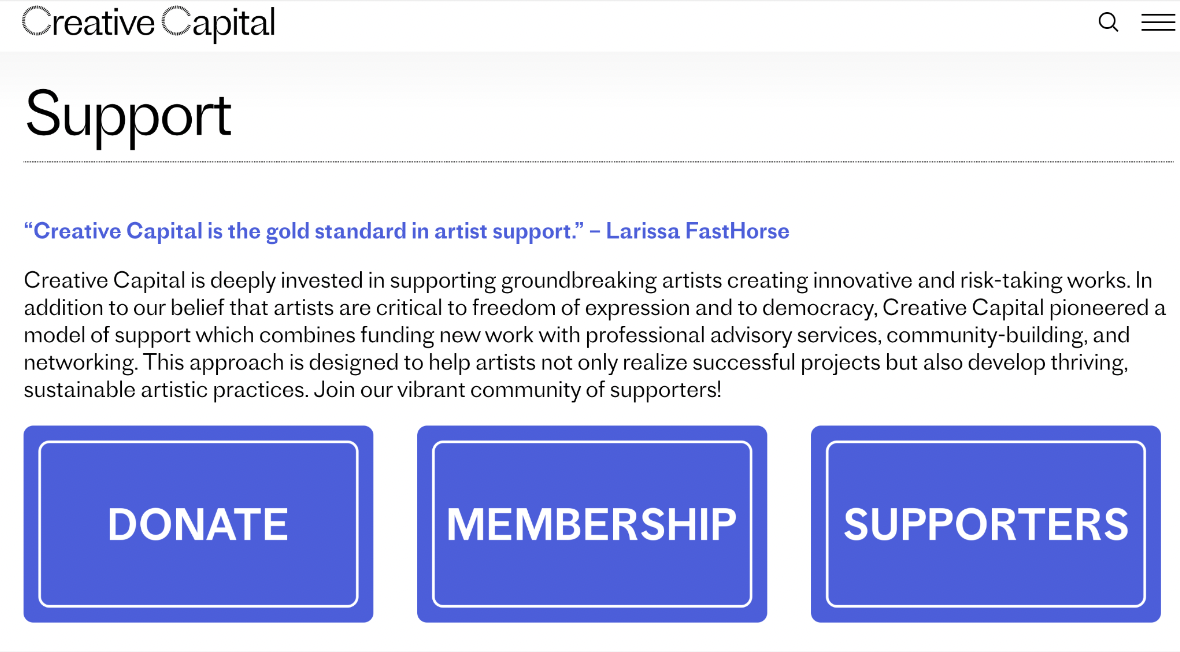
Between March 2022 and March 2023, the Support page received 1,017 views, 7% of the views received by the Board & Staff page. While users have many opportunities to reach the Donate page via embedded Donate buttons throughout the site, this Support page is the only top-level page with additional context on the impact of donations as well as links to pages for Membership and Supporters.
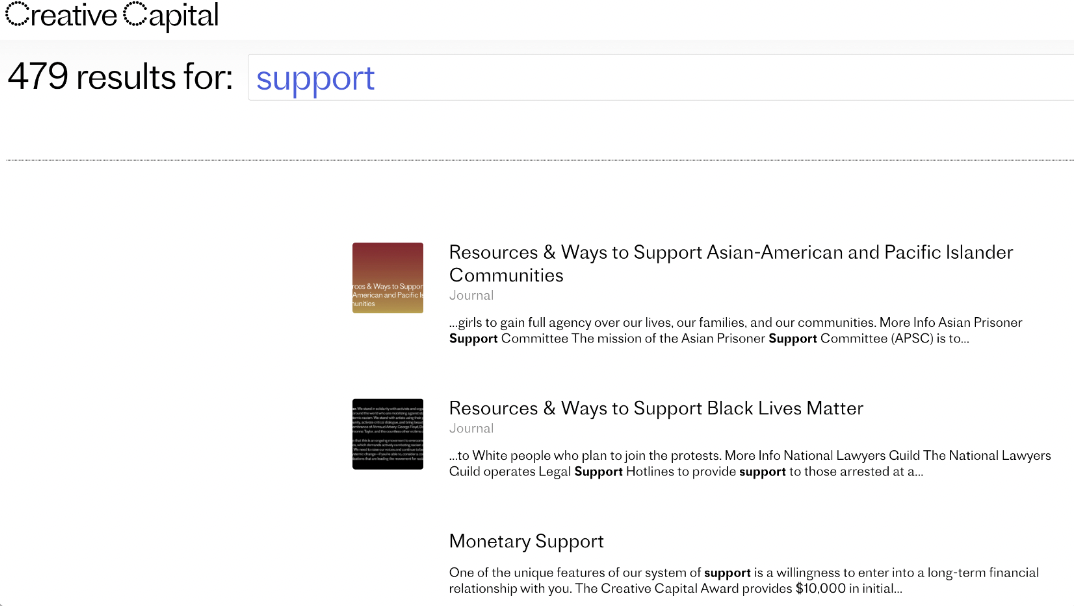
We found that Internal discoverability of the Support page is dampened by the rightful popularity of journal posts supporting social causes like Black Lives Matter and AAPI Communities. Within Creative Capital’s website, the word “support” is used in two different contexts – one to financially support Creative Capital and the other to support social causes. The Support page provides information on how to financially support Creative Capital, however this Support page received fewer views in the period analyzed than journal posts like “Resources & Ways to Support Black Lives Matter”.
PROMPT IN THE FOOTER
Understanding that users may become fatigued from too frequent calls for donations, we still believe in the value of “donate” as the appropriate vocabulary because it is so easily distinguishable from other forms of support. In lieu of synonyms for “donate”, we recommend fewer, well-placed donate buttons across the website.
Key donation pages are not getting nearly as much traffic as grant pages
Example of the internal keyword search highlighting other content
Finding 02: Discoverability of Support page is hidden by support posts for social causes
Finding 3 & Recommendation 2
Finding 03: Donate page lacks impact metrics and visible social media share button
Where did we see this?
The current social media share button is hidden by default behind an arrow icon and can be easily missed. Also potential donors may not have a clear understanding of the organization’s impact, which could discourage them from giving and keep browsing the Support page. By providing specific impact metrics on the Donation page, such as the number of artists supported or the total amount of funding provided for the artists, Creative Capital can provide potential donors with a better understanding of the impact of their contributions. In addition, success stories could be provided to showcase the real-world impact of the organization's grant-making program and inspire potential donors to contribute.
How could this be improved?
Show social media share option by default and unify pages for Donate, Membership, and Support
There are several functions that Creative Capital could potentially integrate into its own donation page to enhance the donor experience and increased engagement and support including:
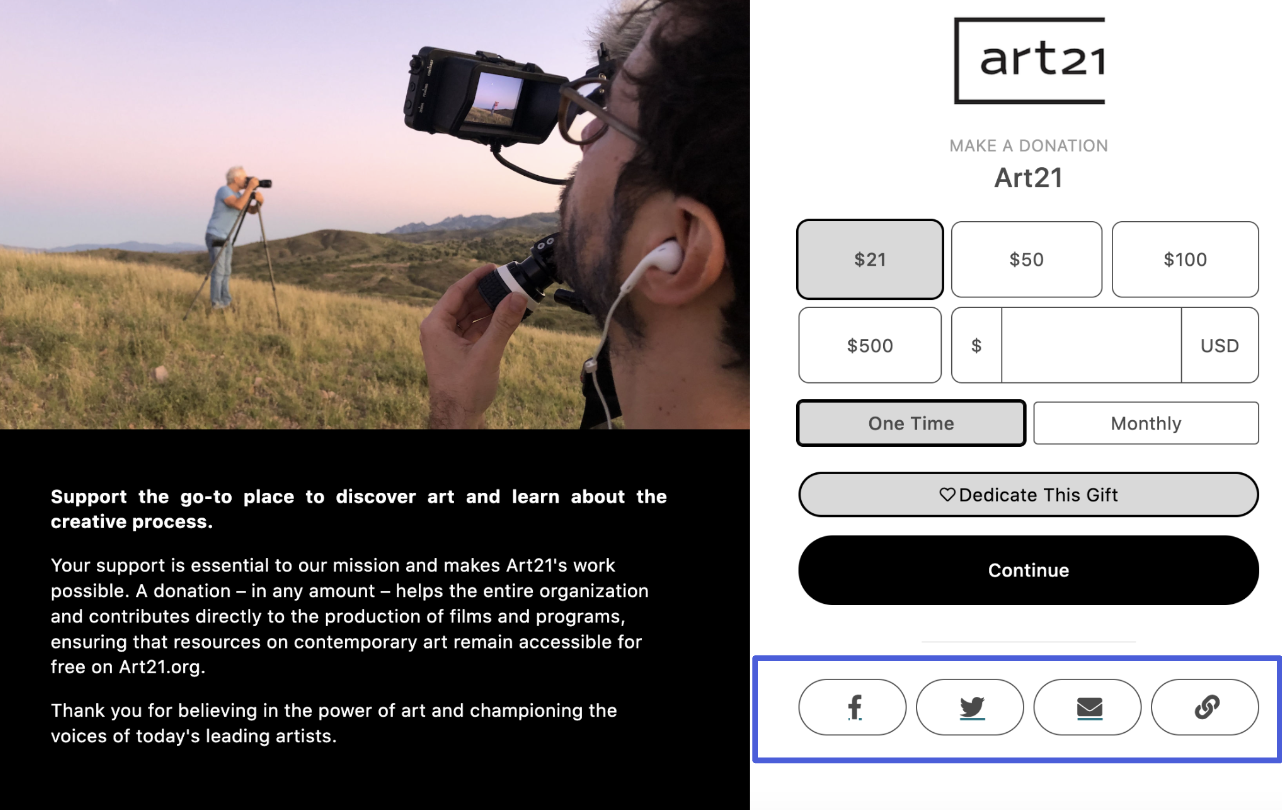
Social sharing options: The Art21 donation page includes straightforward social media sharing buttons, which allow donors to share their contributions on social media and encourage their friends and followers to give as well. Adjusting the social sharing buttons to be more visible may help Creative Capital expand its reach to potential donors.
The current share button on the donation page is not visible
The current Creative Capital Support page
Examples of another non-profit Art21 incorporating share options
Finding & Recommendation 3
Finding 04: Surge in Instagram engagement in April 2022 due to the use of videos, carousels, and themed posts
Where did we see this?
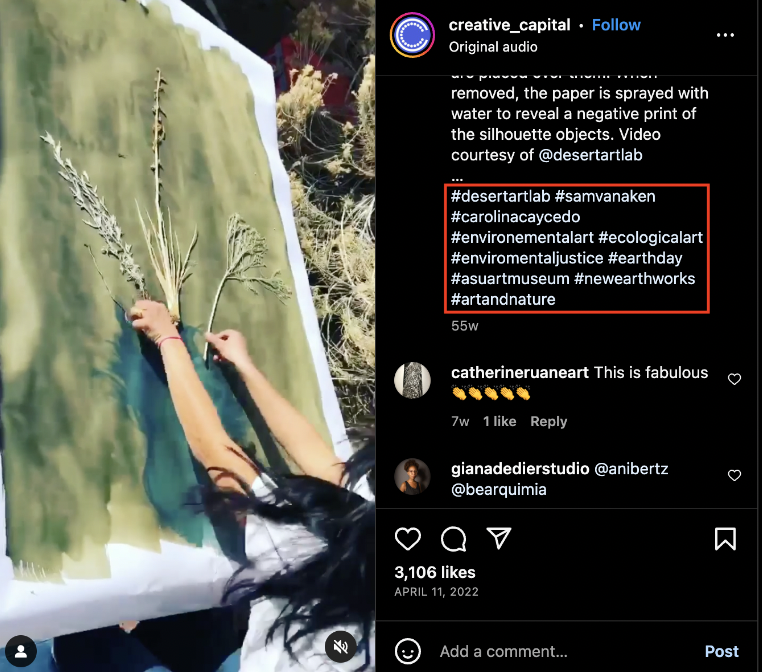
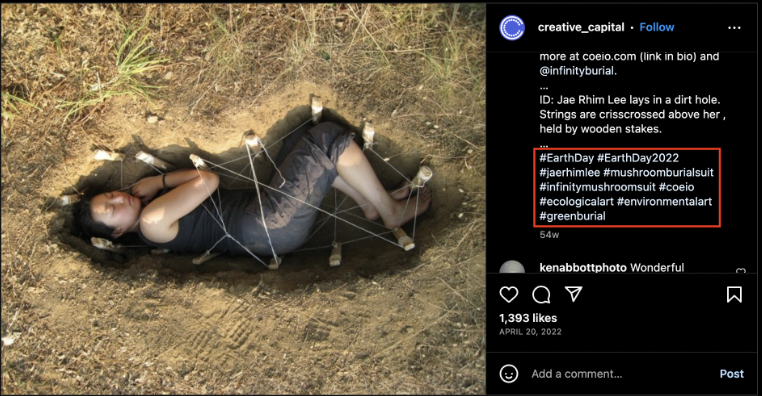
Instagram engagement in April 2022 was 66% higher than average engagement between March 2022 and March 2023. The use of visually engaging content and relevant hashtags can lead to higher engagement rates on Instagram. Specifically, posts that address environmental challenges through art and align with timely themes such as Earth Day tend to have higher engagement rates. Additionally, videos and carousel albums were used more in April 2022 as compared to images which are successful formats for providing dynamic and immersive experiences for viewers.
How could this be improved?
Utilize strategies for dynamic content, themed posts, and data monitoring to engage Instagram audience
We recommend that Creative Capital continue to experiment with videos and carousel albums as successful formats for providing dynamic and immersive experiences for viewers. To further enhance engagement rates, we suggest that Creative Capital improve their captions to be more concise and attention-grabbing and also include:
Use visually engaging content and relevant hashtags
Experiment with videos and carousel albums for dynamic and immersive experiences
Improve captions to be concise and attention-grabbing
Capitalize on timely themes like Earth Day for higher engagement rates
Regularly analyze Instagram metrics for adjusting content strategy
Instagram Engagement data from 1st March 2022 - 1st March 2023
Instagram post with the highest engagement in terms of likes, comments, media reach, reel plays, reel shares and total reel interactions from April 11th, 2022.
What did they think?
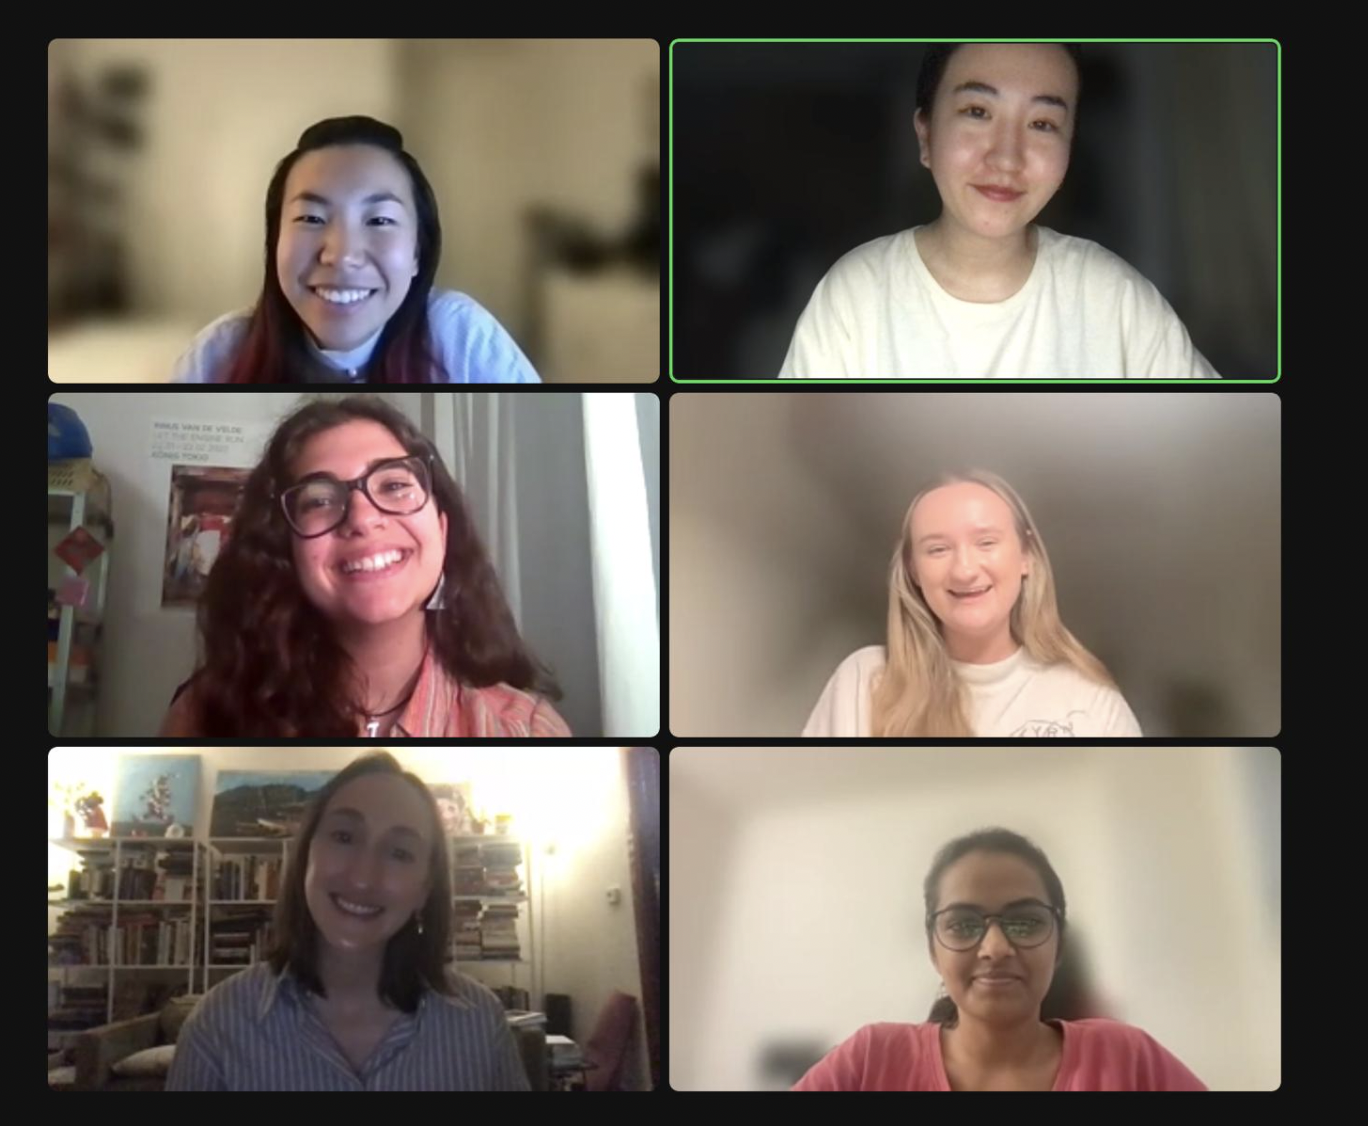
We presented our findings and walked through the dashboards we creative for Creative Capital with Aliza Sena, the Director, Editorial & Digital Content at Creative Capital. She found it really helpful to have one place to reference when she needs to understand and reference how the digital content is performing! Aliza appreciated our approach and research into the donation spaces.
Personal Reflection
I found it great learning how to utilize Digital Analytics tools to understand user behavior in a non-profit organization. This project really opened up my understanding of its capabilities.
I would love to check in with Creative Capital in another quarter to look further into the audience traffic on the event tracking call to actions that we recommended to track in our report and presentation!
Final Team Presentation Meeting with Aliza (Creative Capital)
04
Bringing our findings to Creative Capital!
Client Presentation
Thank you for looking through my work!
More projects are right here >>


